
| Intersoft ClientUI 8 > ClientUI Controls > Control Library > Data Visualization Controls Overview > UXChart > Working with Selection and Data Drilling |
Selection in UXChart can be enabled by setting the CanUserSelect property to True. You can also control the selection individually in each series, by setting the same property that available in each series types.CanUserSelect property in each series has higher precedence than CanUserSelect property in UXChart. If you do not set the property in each series, it will use the one specified in UXChart , on contrary in you set the CanUserSelect property in the series it will override the one specified in UXChart .
| XAML |
Copy Code
|
|---|---|
<Intersoft:UXChart Title="Monthly Sunshine Hours in Melbourne" CanUserSelect="True" SelectedItem="{Binding ChartSelectedItem, Mode=TwoWay}" SelectedItems="{Binding ChartSelectedItems, Mode=TwoWay}" SelectionMode="Single"> <Intersoft:UXChart.Series> <Intersoft:ColumnSeries Title="Melbourne" SelectedItem="{Binding MelbourneSeriesSelectedItem, Mode=TwoWay}" SelectedItems="{Binding MelbourneSeriesSelectedItems, Mode=TwoWay}" ItemsSource="{Binding Melbourne}" IndependentValueBinding="{Binding Month}" DependentValueBinding="{Binding SunshineHours}" /> <Intersoft:ColumnSeries Title="Sydney" SelectedItem="{Binding SydneySeriesSelectedItem, Mode=TwoWay}" SelectedItems="{Binding SydneySeriesSelectedItems, Mode=TwoWay}" ItemsSource="{Binding Sydney}" IndependentValueBinding="{Binding Month}" DependentValueBinding="{Binding SunshineHours}" /> </Intersoft:UXChart.Series> </Intersoft:UXChart> |
|
There are six selection modes that you can choose from.
User can select only one data point at a time across all series
User can select multiple data point across all series using Ctrl Modifier.
User can select multiple data point across all series.
User can select one data point at a time per each series. In other words you might see multiple items selected across all series, but each series will have only one item selected at a time.
User can select multiple data point per same series by using Ctrl Modifier. Whenever user select a data point from other series, the selection on the previous series will be cleared.
User can select multiple data point per same series by using Ctrl Modifier. Whenever user select a data point from other series, the selection on the previous series will be cleared.
Depending on the selection mode you choose, all the selected data point will be stored in SelectedItem property and SelectedItems property. The SelectedItem property contains the last item that user select, while SelectedItems hold all item that user select in the order of user selection. Note that these properties are available in UXChart and all series type. In each series the properties will contain if and only if the data points belong to that series are selected, while the properties in UXChart will hold all selected data point across all series.
Furthermore you can also specify the SelectedItem and SelectedItems from view model; the UXChart will update the selected data point accordingly based on the specified value.
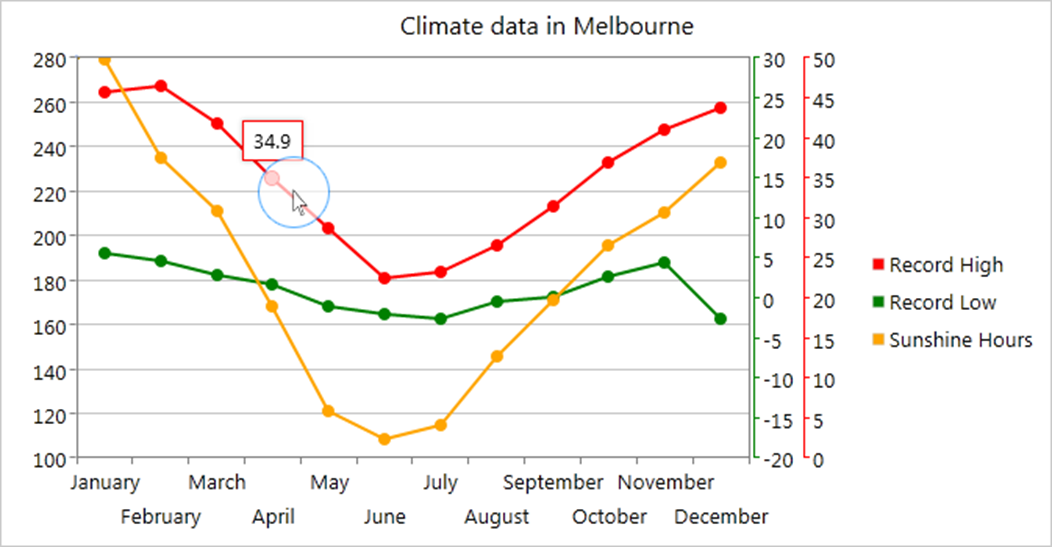
In general you can select the data point by clicking directly at the data point. However some series has rather small shape data point such as; LineSeries family, AreaSeries family, ScatterSeries, RadarSeries, PolarSeries, and BubbleSeries. For these series you can enable nearest data point tracker to highlight which data point is currently nearest to your mouse proximity. When the data point is highlighted you can directly click it and the data point will be selected.
To learn more about nearest data point tracker see the section below.

When the data point is selected it will change the state from Unselected to Selected. You can control the look and feel when the data point selected from the visual state that available in each data point control template as follows.
| XAML |
Copy Code
|
|---|---|
<VisualStateGroup x:Name="SelectionStates"> <VisualStateGroup.Transitions> <VisualTransition GeneratedDuration="0:0:0.1"/> </VisualStateGroup.Transitions> <VisualState x:Name="Unselected"/> <VisualState x:Name="Selected"> <Storyboard> <DoubleAnimation Storyboard.TargetName="SelectionHighlight" Storyboard.TargetProperty="Opacity" To="1" Duration="0"/> </Storyboard> </VisualState> </VisualStateGroup> |
|
Furthermore for some series such as PieSeries and DoughnutSeries, their states are also changed to Exploded when the data point is selected.
| XAML |
Copy Code
|
|---|---|
<VisualStateGroup x:Name="ExplodeStates"> <VisualState x:Name="Collapse"> <Storyboard> <DoubleAnimationUsingKeyFrames BeginTime="00:00:00" Duration="00:00:00.25" Storyboard.TargetName="Root" Storyboard.TargetProperty="(Canvas.Left)"> <SplineDoubleKeyFrame KeyTime="00:00:0.25" Value="0.0" KeySpline="0.5,1 0.5,1"/> </DoubleAnimationUsingKeyFrames> <DoubleAnimationUsingKeyFrames BeginTime="00:00:00" Duration="00:00:00.25" Storyboard.TargetName="Root" Storyboard.TargetProperty="(Canvas.Top)"> <SplineDoubleKeyFrame KeyTime="00:00:0.25" Value="0.0" KeySpline="0.5,1 0.5,1"/> </DoubleAnimationUsingKeyFrames> </Storyboard> </VisualState> <VisualState x:Name="Explode"> <Storyboard> <DoubleAnimationUsingKeyFrames BeginTime="00:00:00" Duration="00:00:00.25" Storyboard.TargetName="Root" Storyboard.TargetProperty="(Canvas.Left)"> <SplineDoubleKeyFrame KeyTime="00:00:0.25" Value="0.0" KeySpline="0.5,1 0.5,1"/> </DoubleAnimationUsingKeyFrames> <DoubleAnimationUsingKeyFrames BeginTime="00:00:00" Duration="00:00:00.25" Storyboard.TargetName="Root" Storyboard.TargetProperty="(Canvas.Top)"> <SplineDoubleKeyFrame KeyTime="00:00:0.25" Value="0.0" KeySpline="0.5,1 0.5,1"/> </DoubleAnimationUsingKeyFrames> </Storyboard> </VisualState> </VisualStateGroup> |
|
To enable data drilling you need to create two or more UXChart in your page. The main chart should have Child property set to the UXChart instance of the next level in your drill down structure.
| XAML |
Copy Code
|
|---|---|
<Grid Intersoft:DockPanel.IsFillElement="True"> <Intersoft:UXChart LegendTitle="Participants" Title="Total Medals per Country" x:Name="Chart1" Child="{Binding ElementName=Chart2}" DrillDownCommand="{Binding DrillDownCommand}"> <Intersoft:UXChart.Series> <Intersoft:PieSeries ItemsSource="{Binding DataSource}" IndependentValueBinding="{Binding Country}" DependentValueBinding="{Binding MedalCount}" /> </Intersoft:UXChart.Series> </Intersoft:UXChart> <Intersoft:UXChart x:Name="Chart2" Visibility="Collapsed" Title="{Binding MedalsPerYearTitle}" Child="{Binding ElementName=Chart3}" DrillDownCommand="{Binding DrillDownCommand}"> <Intersoft:UXChart.Series> <Intersoft:LineSeries DataPointStyle="{Binding MedalsPerYearDataPointStyle}" PathLineBrush="{Binding MedalsPerYearLineBrush}" ItemsSource="{Binding MedalsPerYearDataSource}" IndependentValueBinding="{Binding Year}" DependentValueBinding="{Binding MedalCount}" /> </Intersoft:UXChart.Series> </Intersoft:UXChart> <Intersoft:UXChart x:Name="Chart3" Visibility="Collapsed" Title="{Binding MedalDistributionTitle}"> <Intersoft:UXChart.Series> <Intersoft:ColumnSeries DataPointStyleSelector="{StaticResource MedalsStyleSelector}" ItemsSource="{Binding MedalDistributionDataSource}" IndependentValueBinding="{Binding MedalType}" DependentValueBinding="{Binding MedalCount}" /> </Intersoft:UXChart.Series> </Intersoft:UXChart> </Grid> |
|
 |
Note that it is advisable to set the Visibility property of other charts except main chart to Collapsed to improve the performance. |
With the following configuration you can then handle the drill down gracefully through DrillDownCommand. To learn more about configuring data drill down, see How-to: Enable Data Drill Down.
To learn more about the concepts and more advanced features of the charting control, please refer to the following topics.