
| Intersoft ClientUI 8 > ClientUI Controls > Control Library > Data Visualization Controls Overview > UXChart > UXChart How-to Topics > How-to: Enable Data Drill Down In UXChart |
This example shows how to enable data drill down in UXChart.
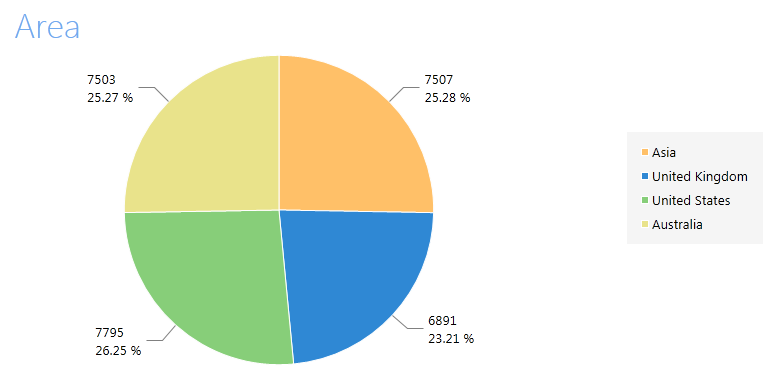
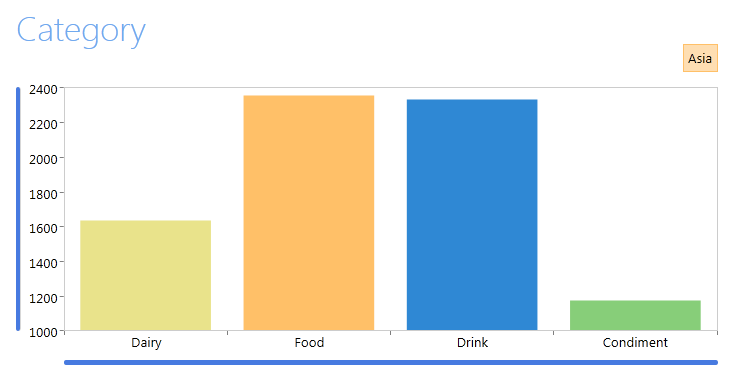
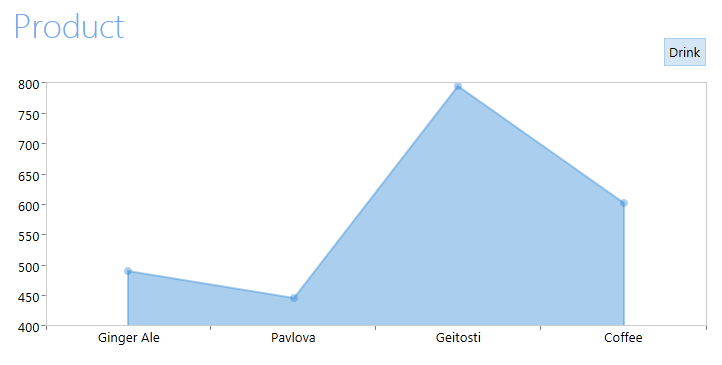
With drilldown feature provided by UXChart, you can easily produce charts that enables data drill down. The data plots in each chart will act as a hotspot to reveal the breakdown values of the selected data. Actually multiple levels of drilldown is supported by UXChart through it solid architecture. In this scenario, UXChart will display the sales data based on area at first, then followed by sales based on category in the selected area. Users can perform drill down by double clicking on an area of interest. In the 3rd level, the sales data will be drilled down again into sales based on product when a category is selected.
The following code shows how to implement data drill down in UXChart. You will notice that you need to specify the child of the chart, which can be specified through binding.
| XAML |
Copy Code
|
|---|---|
<Grid> <Grid.DataContext> <ViewModels:SalesDrillDownViewModel/> </Grid.DataContext> <Intersoft:UXChart Name="Chart1" Title="Area" Child="{Binding ElementName=Chart2}" DrillDownCommand="{Binding DrillDownCommand}"> <Intersoft:UXChart.Series> <Intersoft:PieSeries ItemsSource="{Binding AreaSales}" IndependentValueBinding="{Binding Area}" DependentValueBinding="{Binding Sales}" /> </Intersoft:UXChart.Series> </Intersoft:UXChart> <Intersoft:UXChart Name="Chart2" Title="Category" Child="{Binding ElementName=Chart3}" Visibility="Collapsed" DrillUpCommand ="{Binding DrillUpCommand}" DrillDownCommand="{Binding DrillDownCommand}"> <Intersoft:UXChart.Series> <Intersoft:ColumnSeries Title="{Binding ChartName}" ItemsSource="{Binding CategorySales}" IndependentValueBinding="{Binding Category}" DependentValueBinding="{Binding Sales}" /> </Intersoft:UXChart.Series> </Intersoft:UXChart> <Intersoft:UXChart Name="Chart3" Title="Product" DrillUpCommand ="{Binding DrillUpCommand}" Visibility="Collapsed"> <Intersoft:UXChart.Series> <Intersoft:AreaSeries Title="{Binding CategoryName}" ItemsSource="{Binding ProductSales}" IndependentValueBinding="{Binding Product}" DependentValueBinding="{Binding Sales}" /> </Intersoft:UXChart.Series> </Intersoft:UXChart> </Grid> |
|
| C# |
Copy Code
|
|---|---|
public class SalesDrillDownViewModel : ViewModelBase { #region Fields private ObservableCollection<SalesDrillDownData> _areaSales; private ObservableCollection<SalesDrillDownData> _categorySales; private ObservableCollection<SalesDrillDownData> _productSales; private string _selectedArea; private string _selectedCategory; #endregion #region Properties public ObservableCollection<SalesDrillDownData> AreaSales { get; set; } public ObservableCollection<SalesDrillDownData> CategorySales { get; set; } public ObservableCollection<SalesDrillDownData> ProductSales { get; set; } public string SelectedArea { get { return _selectedArea; } set { if (_selectedArea != value) { _selectedArea = value; OnPropertyChanged("SelectedArea"); } } } public string SelectedCategory { get { return _selectedCategory; } set { if (_selectedCategory != value) { _selectedCategory = value; OnPropertyChanged("SelectedCategory"); } } } #endregion #region Commands public DelegateCommand DrillDownCommand { get; set; } public DelegateCommand DrillUpCommand { get; set; } #endregion #region Data Source public IEnumerable<SalesDrillDownData> DataSource { get { return DataManager.Instance.SalesDrillDownData; } } #endregion #region Constructor public SalesDrillDownViewModel() { this.DrillDownCommand = new DelegateCommand(ExecuteDrillDown); this.DrillUpCommand = new DelegateCommand(ExecuteDrillUp); this.AreaSales = this.GetAreas(); } #endregion #region Methods private void ExecuteDrillDown(object parameter) { UXChartDrillDownCommandArgs args = parameter as UXChartDrillDownCommandArgs; if (args.Level == 1) { SalesDrillDownData parent = args.DataPointContext as SalesDrillDownData; if (parent != null) { this.SelectedArea = parent.Area; this.CategoriesSales = this.GetCategories(); } } else if (args.Level == 2) { SalesDrillDownData parent = args.DataPointContext as SalesDrillDownData; if (parent != null) { this.SelectedCategory = parent.Category; this.ProductSales = this.GetProducts(); } } } private void ExecuteDrillUp(object parameter) { UXChartDrillDownCommandArgs args = parameter as UXChartDrillDownCommandArgs; if (args.Level == 2) this.CategorySales.Clear(); else if (args.Level == 3) this.ProductSales.Clear(); } private ObservableCollection<SalesDrillDownData> GetAreas() { ObservableCollection<SalesDrillDownData> areas = new ObservableCollection<SalesDrillDownData>(); foreach (IGrouping<string, SalesDrillDownData> groupData in this.DataSource.GroupBy(p => p.Area)) { List<SalesDrillDownData> data = groupData.ToList(); if (data != null && data.Count > 0) { SalesDrillDownData firstData = data.FirstOrDefault(); if (firstData != null) areas.Add(new SalesDrillDownData() { Area = firstData.Area, Sales = data.Sum(p => p.Sales) }); } } return areas; } private ObservableCollection<SalesDrillDownData> GetCategories(string area) { ObservableCollection<SalesDrillDownData> categories = new ObservableCollection<SalesDrillDownData>(); foreach (IGrouping<string, SalesDrillDownData> groupData in this.DataSource.Where(p => p.Area == area).GroupBy(p => p.Category)) { List<SalesDrillDownData> data = groupData.ToList(); if (data != null && data.Count > 0) { SalesDrillDownData firstData = data.FirstOrDefault(); if (firstData != null) categories.Add(new SalesDrillDownData() { Area = firstData.Area, Category = firstData.Category, Sales = data.Sum(p => p.Sales) }); } } return categories; } private ObservableCollection<SalesDrillDownData> GetProducts(string area, string category) { ObservableCollection<SalesDrillDownData> products = new ObservableCollection<SalesDrillDownData>(); foreach (IGrouping<string, SalesDrillDownData> groupData in this.DataSource.Where(o => o.Area == area && o.Category == category).GroupBy(o => o.Product)) { List<SalesDrillDownData> data = groupData.ToList(); if (data != null && data.Count > 0) { SalesDrillDownData firstData = data.FirstOrDefault(); if (firstData != null) products.Add(new SalesDrillDownData() { Area = firstData.Area, Category = firstData.Category, Product = firstData.Product, Sales = data.Sum(p => p.Sales) }); } } return products; } #endregion } |
|
After implementing these code, the results will look like the following image.

When an area is selected, sales data based on category will be shown, as follows.

When a category is selected, sales data based on product will be shown, as follows.
