Intersoft ClientUI Documentation
How-to: Add Custom Palettes In UXChart

| Intersoft ClientUI 8 > ClientUI Controls > Control Library > Data Visualization Controls Overview > UXChart > UXChart How-to Topics > How-to: Add Custom Palettes In UXChart |
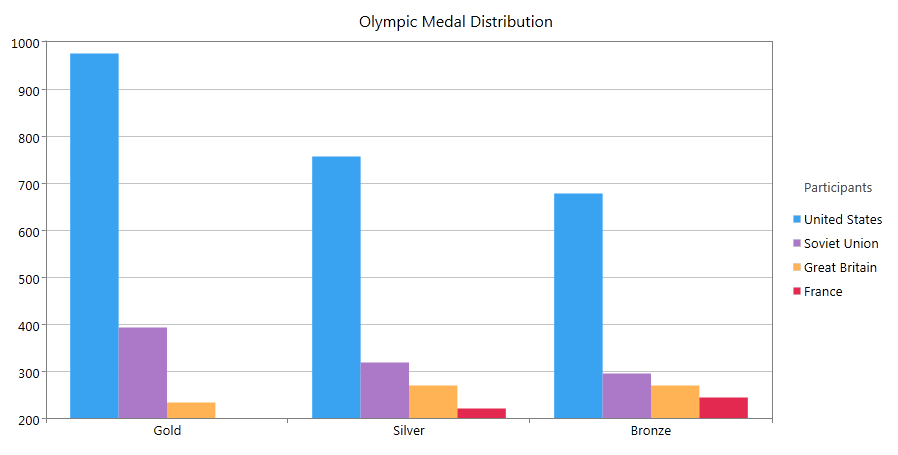
This example shows how to add custom palettes in UXChart.
By default, UXChart provides some built-in palettes which can be customized via the Palette property. Actually the color of the data series are defined based on these palettes. In addition, UXChart also allows you to define your own style by using custom palette.
The following code shows how to use custom palettes in UXChart.
| XAML |
Copy Code
|
|---|---|
<Grid> <Grid.Resources> <Style x:Key="DataShapeStyleBase" TargetType="Shape"> <Setter Property="StrokeThickness" Value="2"/> <Setter Property="StrokeMiterLimit" Value="1"/> </Style> <Intersoft:ResourceDictionaryCollection x:Key="CustomPalette"> <!-- Blue --> <ResourceDictionary> <Color x:Key="Color">#397249</Color> <SolidColorBrush x:Key="Background" Color="{StaticResource Color}"/> <SolidColorBrush x:Key="PathLineBrush" Opacity="1" Color="{StaticResource Color}"/> <SolidColorBrush x:Key="PathFillBrush" Opacity="0.4" Color="{StaticResource Color}"/> <Style x:Key="DataPointStyle" TargetType="Control"> <Setter Property="Background" Value="{StaticResource Background}"/> </Style> <Style x:Key="DataShapeStyle" TargetType="Shape" BasedOn="{StaticResource DataShapeStyleBase}"> <Setter Property="Stroke" Value="{StaticResource PathLineBrush}"/> <Setter Property="Fill" Value="{StaticResource PathFillBrush}"/> </Style> </ResourceDictionary> <!-- Purple --> <ResourceDictionary> <Color x:Key="Color">#628B61</Color> <SolidColorBrush x:Key="Background" Color="{StaticResource Color}"/> <SolidColorBrush x:Key="PathLineBrush" Opacity="1" Color="{StaticResource Color}"/> <SolidColorBrush x:Key="PathFillBrush" Opacity="0.4" Color="{StaticResource Color}"/> <Style x:Key="DataPointStyle" TargetType="Control"> <Setter Property="Background" Value="{StaticResource Background}"/> </Style> <Style x:Key="DataShapeStyle" TargetType="Shape" BasedOn="{StaticResource DataShapeStyleBase}"> <Setter Property="Stroke" Value="{StaticResource PathLineBrush}"/> <Setter Property="Fill" Value="{StaticResource PathFillBrush}"/> </Style> </ResourceDictionary> <!-- Orange --> <ResourceDictionary> <Color x:Key="Color">#9CB770</Color> <SolidColorBrush x:Key="Background" Color="{StaticResource Color}"/> <SolidColorBrush x:Key="PathLineBrush" Opacity="1" Color="{StaticResource Color}"/> <SolidColorBrush x:Key="PathFillBrush" Opacity="0.4" Color="{StaticResource Color}"/> <Style x:Key="DataPointStyle" TargetType="Control"> <Setter Property="Background" Value="{StaticResource Background}"/> </Style> <Style x:Key="DataShapeStyle" TargetType="Shape" BasedOn="{StaticResource DataShapeStyleBase}"> <Setter Property="Stroke" Value="{StaticResource PathLineBrush}" > <Setter Property="Fill" Value="{StaticResource PathFillBrush}"/> </Style> </ResourceDictionary> <!-- Red --> <ResourceDictionary> <Color x:Key="Color">#C7E1BA</Color> <SolidColorBrush x:Key="Background" Color="{StaticResource Color}"/> <SolidColorBrush x:Key="PathLineBrush" Opacity="1" Color="{StaticResource Color}"/> <SolidColorBrush x:Key="PathFillBrush" Opacity="0.4" Color="{StaticResource Color}"/> <Style x:Key="DataPointStyle" TargetType="Control"> <Setter Property="Background" Value="{StaticResource Background}"/> </Style> <Style x:Key="DataShapeStyle" TargetType="Shape" BasedOn="{StaticResource DataShapeStyleBase}"> <Setter Property="Stroke" Value="{StaticResource PathLineBrush}"/> <Setter Property="Fill" Value="{StaticResource PathFillBrush}"/> </Style> </ResourceDictionary> </Intersoft:ResourceDictionaryCollection> </Grid.Resources/> <Intersoft:UXChart LegendTitle="Participants" Title="Olympic Medal Distribution" PaletteType="Custom" CustomPaletteName="CustomPalette" PaletteOrder="Sequential"> <Intersoft:UXChart.CustomPalettes> <Intersoft:Palette PaletteName="CustomPalette" PaletteResource="{StaticResource CustomPalette}"/> </Intersoft:UXChart.CustomPalettes> <Intersoft:UXChart.Series> <Intersoft:ColumnSeries Title="USA" ItemsSource="{Binding MedalDistributionForUSA.Medals}" IndependentValueBinding="{Binding MedalType}" DependentValueBinding="{Binding MedalCount}"/> <Intersoft:ColumnSeries Title="Soviet Union" ItemsSource="{Binding MedalDistributionForSovietUnion.Medals}" IndependentValueBinding="{Binding MedalType}" DependentValueBinding="{Binding MedalCount}"/> <Intersoft:ColumnSeries Title="Great Britain" ItemsSource="{Binding MedalDistributionForGreatBritain.Medals}" IndependentValueBinding="{Binding MedalType}" DependentValueBinding="{Binding MedalCount}"/> <Intersoft:ColumnSeries Title="France" ItemsSource="{Binding MedalDistributionForFrance.Medals}" IndependentValueBinding="{Binding MedalType}" DependentValueBinding="{Binding MedalCount}"/> </Intersoft:UXChart.Series> </Intersoft:UXChart> </Grid> |
|
After implementing these code, the results will look like the following image.
