Intersoft ClientUI Documentation
How-to: Customize Axis Interval In UXChart

| Intersoft ClientUI 8 > ClientUI Controls > Control Library > Data Visualization Controls Overview > UXChart > UXChart How-to Topics > How-to: Customize Axis Interval In UXChart |
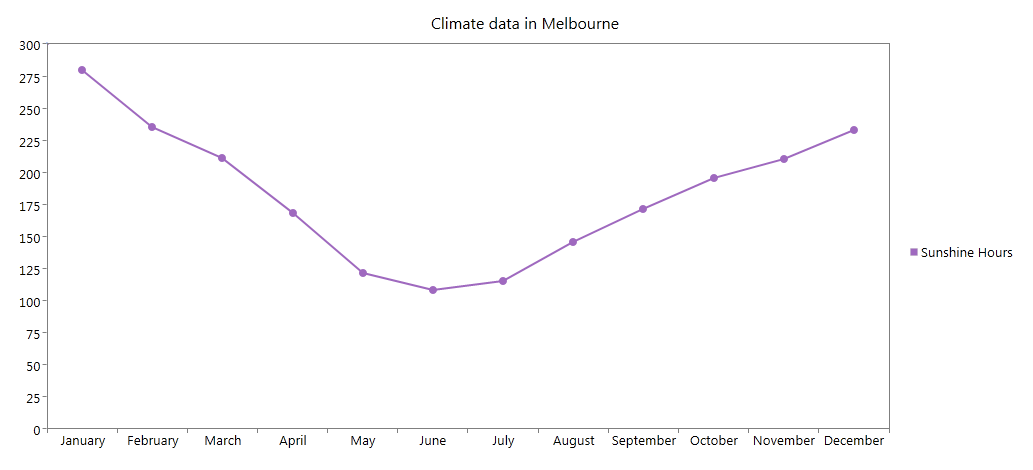
This example shows how to customize axis interval in UXChart.
By default, UXChart will automatically calculate the axis interval based on the provided data. However, it also allows you to customize it by specifying an exact interval for each axis. In this scenario, the axis Interval will be set to 5.
The following code shows how to customize axis interval in UXChart.
| XAML |
Copy Code
|
|---|---|
<Intersoft:UXChart Title="Climate data in Melbourne"> <Intersoft:UXChart.Series> <Intersoft:LineSeries Title="Sunshine Hours" ItemsSource="{Binding DataSource}" IndependentValueBinding="{Binding Month}" DependentValueBinding="{Binding SunshineHours}"> <Intersoft:LineSeries.DependentRangeAxis> <Intersoft:LinearAxis Minimum="0" Maximum="300" Interval="5" Orientation="Y"/> </Intersoft:LineSeries.DependentRangeAxis> </Intersoft:LineSeries> </Intersoft:UXChart.Series> </Intersoft:UXChart> |
|
After implementing these code, the results will look like the following image.
