Intersoft ClientUI Documentation
How-to: Add Additional Grid Lines In UXChart

| Intersoft ClientUI 8 > ClientUI Controls > Control Library > Data Visualization Controls Overview > UXChart > UXChart How-to Topics > How-to: Add Additional Grid Lines In UXChart |
This example shows how to add additional grid lines in UXChart.
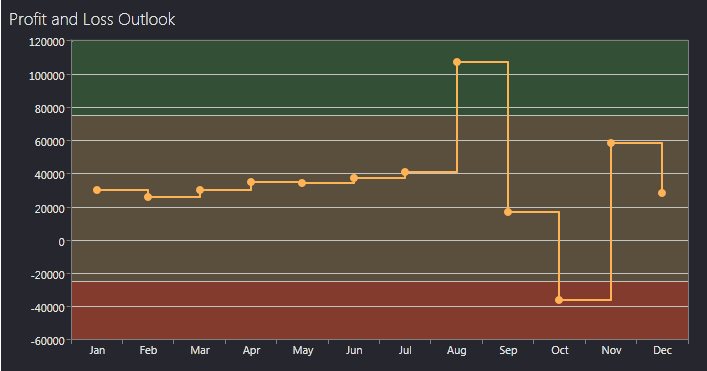
Besides the horizontal and vertical grid line which can be specified in each axes, UXChart also allows you to define AdditionalGridLines to make the chart more readable and intuitive. In some cases, you will need to provide an explanation that users can easily understand at a glance. The following example shows how to use additional grid lines to mark whether the company earn huge profits or losses.
The following code describes how to add additional grid lines in UXChart.
| XAML |
Copy Code
|
|---|---|
<Intersoft:UXChart Title="Profit and Loss Outlook"> <Intersoft:UXChart.DependentLinearAxisStyle> <Style TargetType="Intersoft:LinearAxis"> <Setter Property="Orientation" Value="Y"/> <Setter Property="ShowGridLines" Value="True"/> <Setter Property="AdditionalGridLines"> <Setter.Value> <Intersoft:AdditionalGridLineCollection> <Intersoft:AdditionalGridLine Value="500000"> <Intersoft:AdditionalGridLine.GridLineStyle> <Style TargetType="Intersoft:GridLine"> <Setter Property="Background" Value="#405BCC51"/> </Style> </Intersoft:AdditionalGridLine.GridLineStyle> </Intersoft:AdditionalGridLine> <Intersoft:AdditionalGridLine Value="75000"> <Intersoft:AdditionalGridLine.GridLineStyle> <Style TargetType="Intersoft:GridLine"> <Setter Property="Background" Value="#40CC5151"/> </Style> </Intersoft:AdditionalGridLine.GridLineStyle> </Intersoft:AdditionalGridLine> <Intersoft:AdditionalGridLine Value="-25000"> <Intersoft:AdditionalGridLine.GridLineStyle> <Style TargetType="Intersoft:GridLine"> <Setter Property="Background" Value="#40FF0000"/> </Style> </Intersoft:AdditionalGridLine.GridLineStyle> </Intersoft:AdditionalGridLine> </Intersoft:AdditionalGridLineCollection> </Setter.Value> </Setter> </Style> </Intersoft:UXChart.DependentLinearAxisStyle> <Intersoft:UXChart.Series> <Intersoft:LineSeries Title="Bing" ItemsSource="{Binding ProfitLossPerMonth}" IndependentValueBinding="{Binding Month}" DependentValueBinding="{Binding Income}"/> </Intersoft:UXChart.Series> </Intersoft:UXChart |
|
After implementing these code, the results will looks like the following image.
