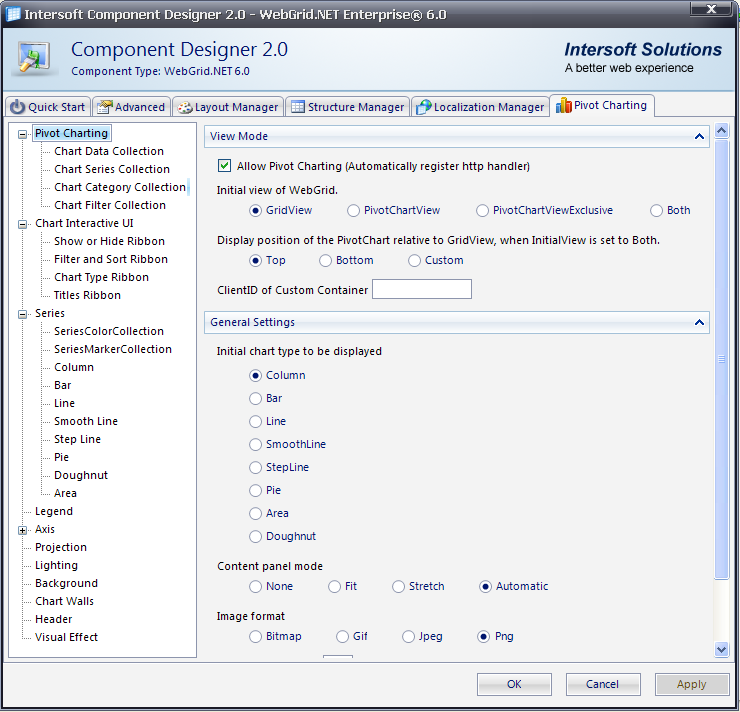
WebGrid has come up with an addition tab to its designer, which is Pivot Charting. The new expandable and collapsible user interface allows you to quickly locate a feature. Most settings are presented in check box and radio selection interface which are designed to help you instantly enable or disable, or modify a feature with one mouse click.

In Pivot Charting tab, it is divided into 11 sections which are:
- Pivot Charting
This section allows user to customize the general settings of pivot charting, such as allow pivot charting, initial chart type, image format and many more.
- Chart Interactive UI
This section allows user to customize pivot charting user interface, such as show/hide ribbon, filter and sort ribbon, chart type ribbon and titles ribbon.
- Series
This section allows user to customize the series feature available in pivot charting, such as column, bar, line, pie, doughnut and many more.
- Legend
This section allows user to customize pivot charting's legend such as its docking position.
- Axis
This section allows user to customize the pivot charting's axis, which has 7 types of label orientation mode. They are SingleLevel, Stagger2, Stagger3, Rotate30, Rotate45, Rotate90 and AutoScale.
- Projection
This section allows user to customize the predefined or custom projection.
- Lighting
This section allows user to customize light sources to create stunning chart 3D images.
- Background
This section allows user to customize Fill and Frame styles to apply chart's background.
- Chart Walls
This section allows user to customize the chart's walls styles properties such as BorderStyle, FillStyle and ShadowStyle.
- Header
This section allows user to customize the chart header's position to TopLeft, TopCenter, TopRIght, BottomLeft, BottomCenter and BottomRight.
- Visual Effects
This section allows user to customize the jittering deviation and steps to make the 3D chart looks smooth.
Getting Started
Getting Started
Overview
WebGrid Features Overview
Other Resources
Walkthrough Topics
How-to Topics


