


This walkthrough shows you how to apply lighting effect to 3D chart types.
During this walkthrough, you will learn how to do the following:
- Use AccessDataSource.
- Use SmartTag to set DataSource.
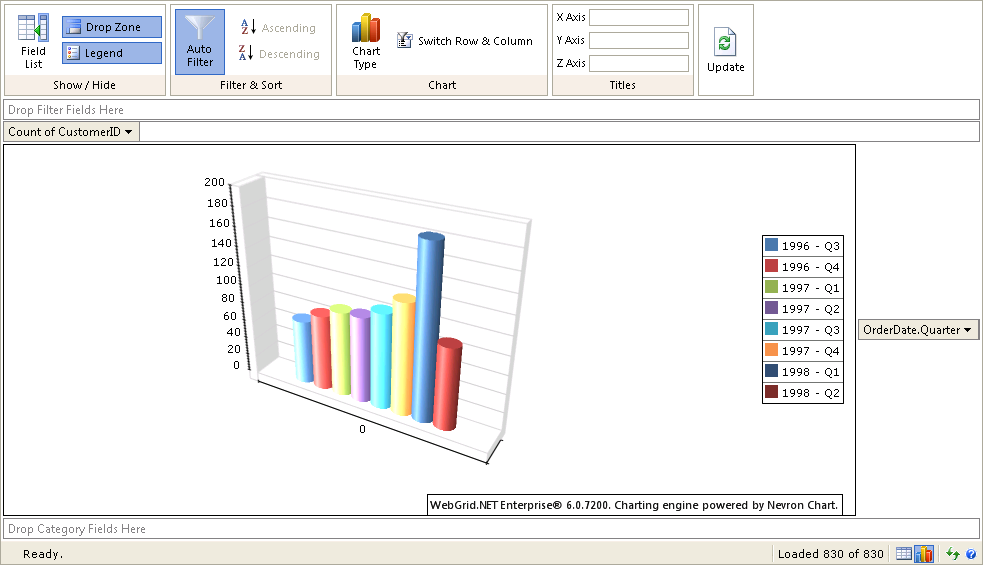
- Set Pivot Chart View for WebGrid.
- Set lightning for 3D chart types.
 Prerequisites
In order to complete this walkthrough, you will need the following:
- Access to the Microsoft Access Northwind database.
- Visual Studio 2005/2008/2010 Application.
Step-By-Step Instructions
To apply lighting effect to 3D chart types
- Bind WebGrid to AccessDataSource control.
- Click on WebGrid instance and press F4 to open its Properties window.
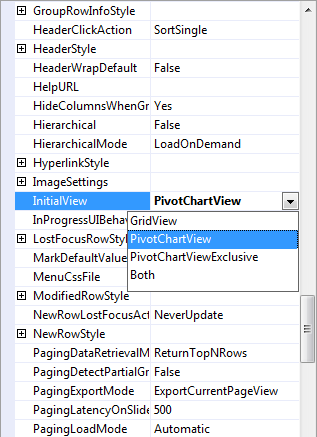
- Expand LayoutSettings and set the InitialView property to PivotChartView.
- Right-click on WebGrid instance and select WebGrid.NET Designer.
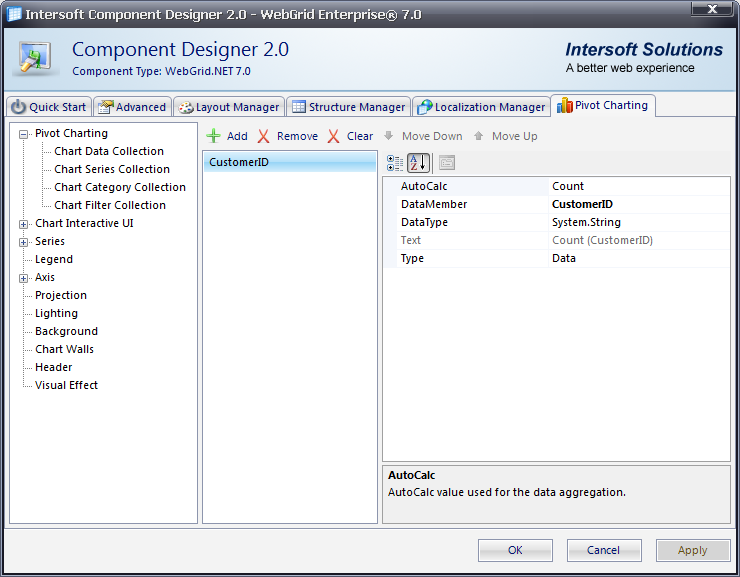
- Set the Chart Data Collection property in Pivot Charting tab >> Pivot Charting.
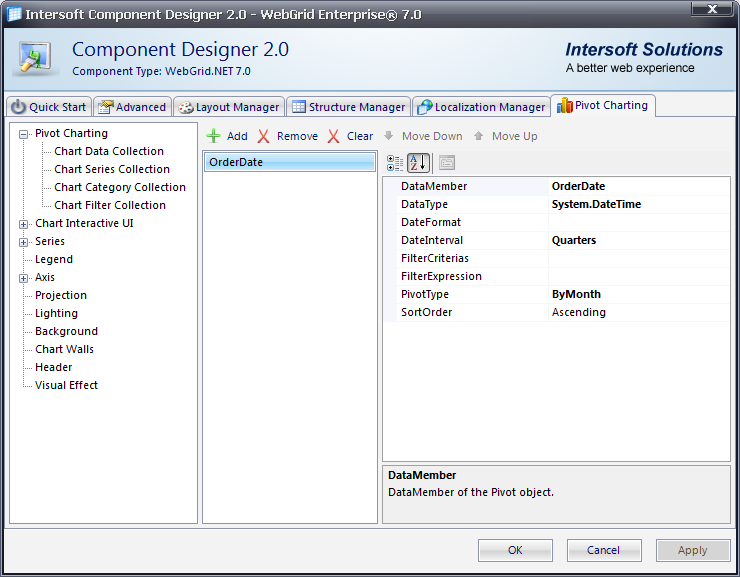
- Set the Chart Series Collection property in Pivot Charting tab >> Pivot Charting.
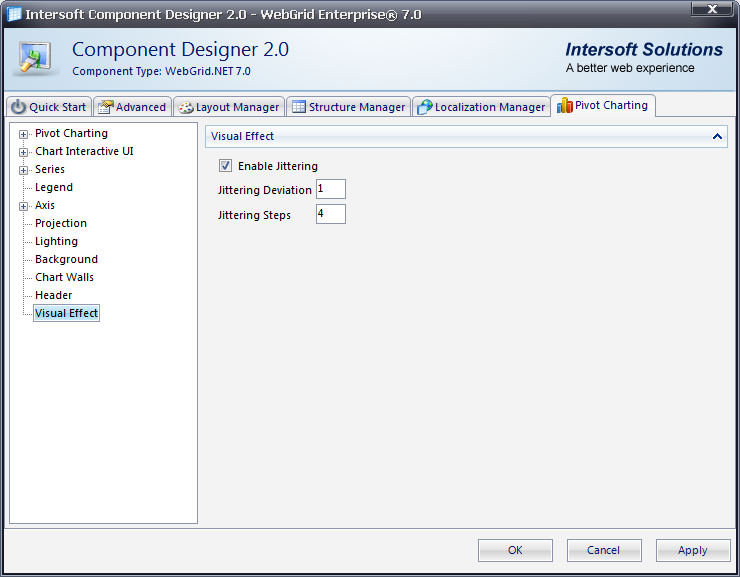
- You also need to set the VisualEffect property in Pivot Charting tab.
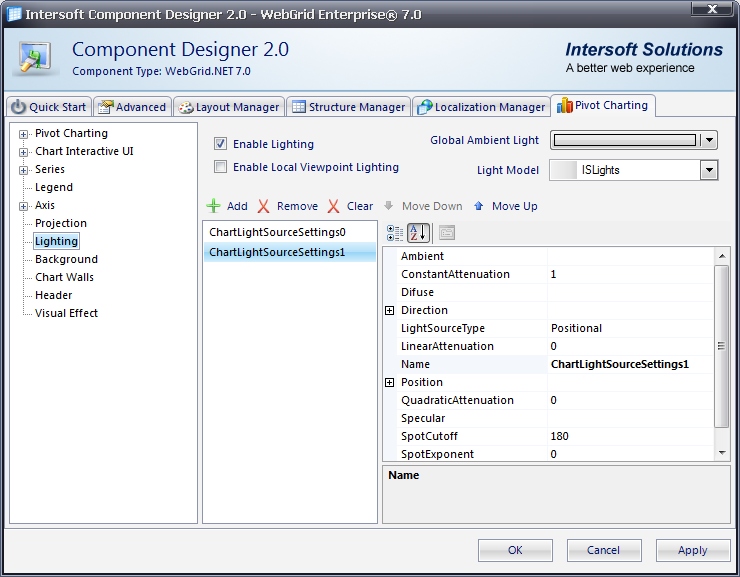
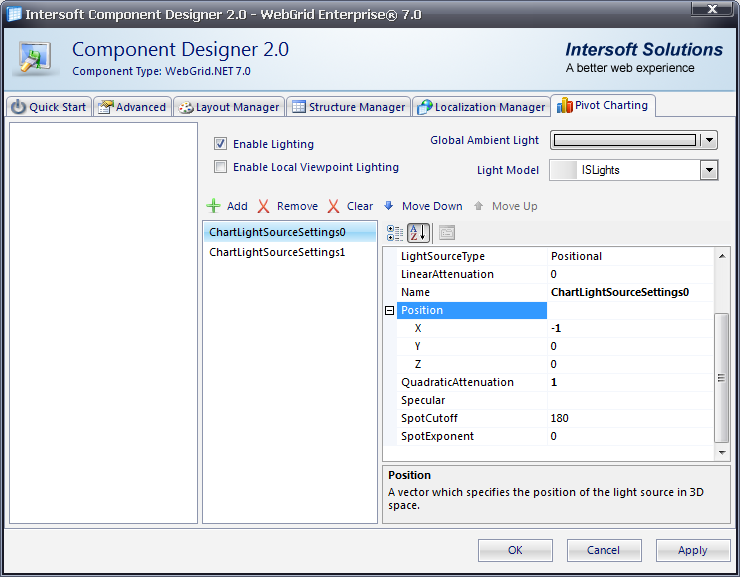
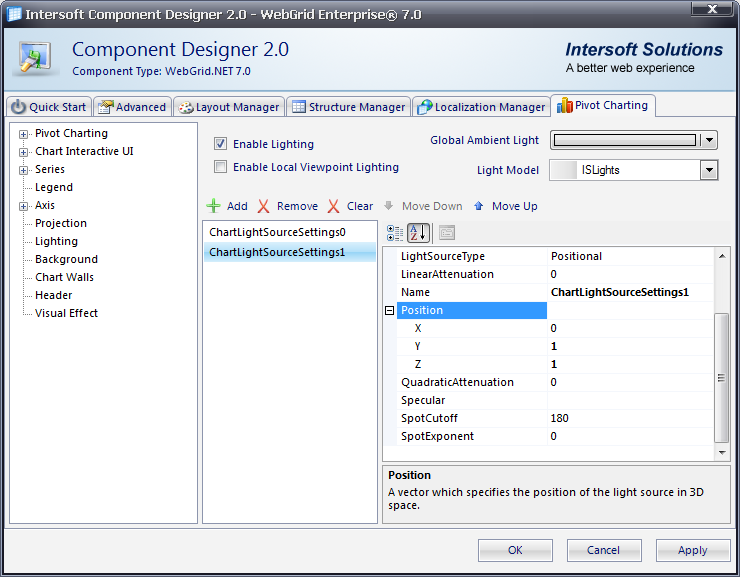
- Set the Lighting property in Pivot Charting tab.
- Run the project.
 See Also
Other Resources
Walkthrough Topics
How-to Topics